The GovLab Index on Internet Governance — Trade
30 September 2014
Please find below the latest installment of the GovLab Index on Internet Governance, inspired by the Harper’s Index. “Internet Governance — Trade” is part of a series of Indexes that focus on the five main areas within Internet Governance: access, content, code, trust, and trade. This edition focuses on digital cross border trade and cryptocurrencies. Previous installments in the series include Internet Governance — Code, Internet Governance — Content and Internet Governance — Access.
Digital Cross Border Trade
- Forecasted revenue of annual global cross-border e-commerce revenues by 2025: between $250 billion and $350 billion, up from about $80 billion in 2014
- Amount of total revenue that Asia is predicted to account for: 40%
- Europe: 25%
- North America: 20%
- Value of United States’s exports of digitally-deliverable services in 2011: $357.4 billion
- Percentage of total exports of services by the US: over 60%
- Value of digitally-deliverable services imported by the US in 2011: $221.9 billion
- Percentage of total imports of services by the US: 56%
- Value of the US trade surplus in digitally-delivered services in 2011: $135.5 billion
- Countries where the United States exported the highest value of digitally-deliverable services: United Kingdom, Canada, Ireland, and Japan
- Countries from where the highest values of US digitally-deliverable imports came from: United Kingdom, Bermuda, Switzerland, and Canada
- Top three services that make up the largest share of the US’ digitally-delivered services exports: business, professional, and technical services (38%), royalties and license fees (34%), and financial services (21%)
- Value of China’s cross-border ecommerce in 2012: $375 billion, up 31.5% from 2011
- Country that purchased the most goods/services from China: United States, 17.2% of total
- Overall turnover of cross-border sales in Europe in 2013: 44 billion euros
- Turnover of domestic e-commerce sales: 306 billion euros
- Predicted overall turnover of cross-border ecommerce sales in Europe in 2018: $116 million
- How many European consumers purchase online: 40%
- How many of those 40% make purchases in other countries in the EU: 7%
- How many Latin America shoppers find the products they search for on U.S. e-commerce sites: 3 in 4
Cryptocurrencies: Bitcoin
Activity and Usage
- The price, or value, of a Bitcoin as of Sept 17, 2014: $455 USD
- Total number of Bitcoins: 13,266,474
- How many Bitcoin transactions are made on average per hour: 3,219
- Value of the average Bitcoin transaction: $2,635 USD
Comparison with other payment systems
- Average daily transaction volume for Bitcoin: $289 million
- Visa: $16,518 million
- China Union Pay: $7,562 million
- PayPal: $397 million
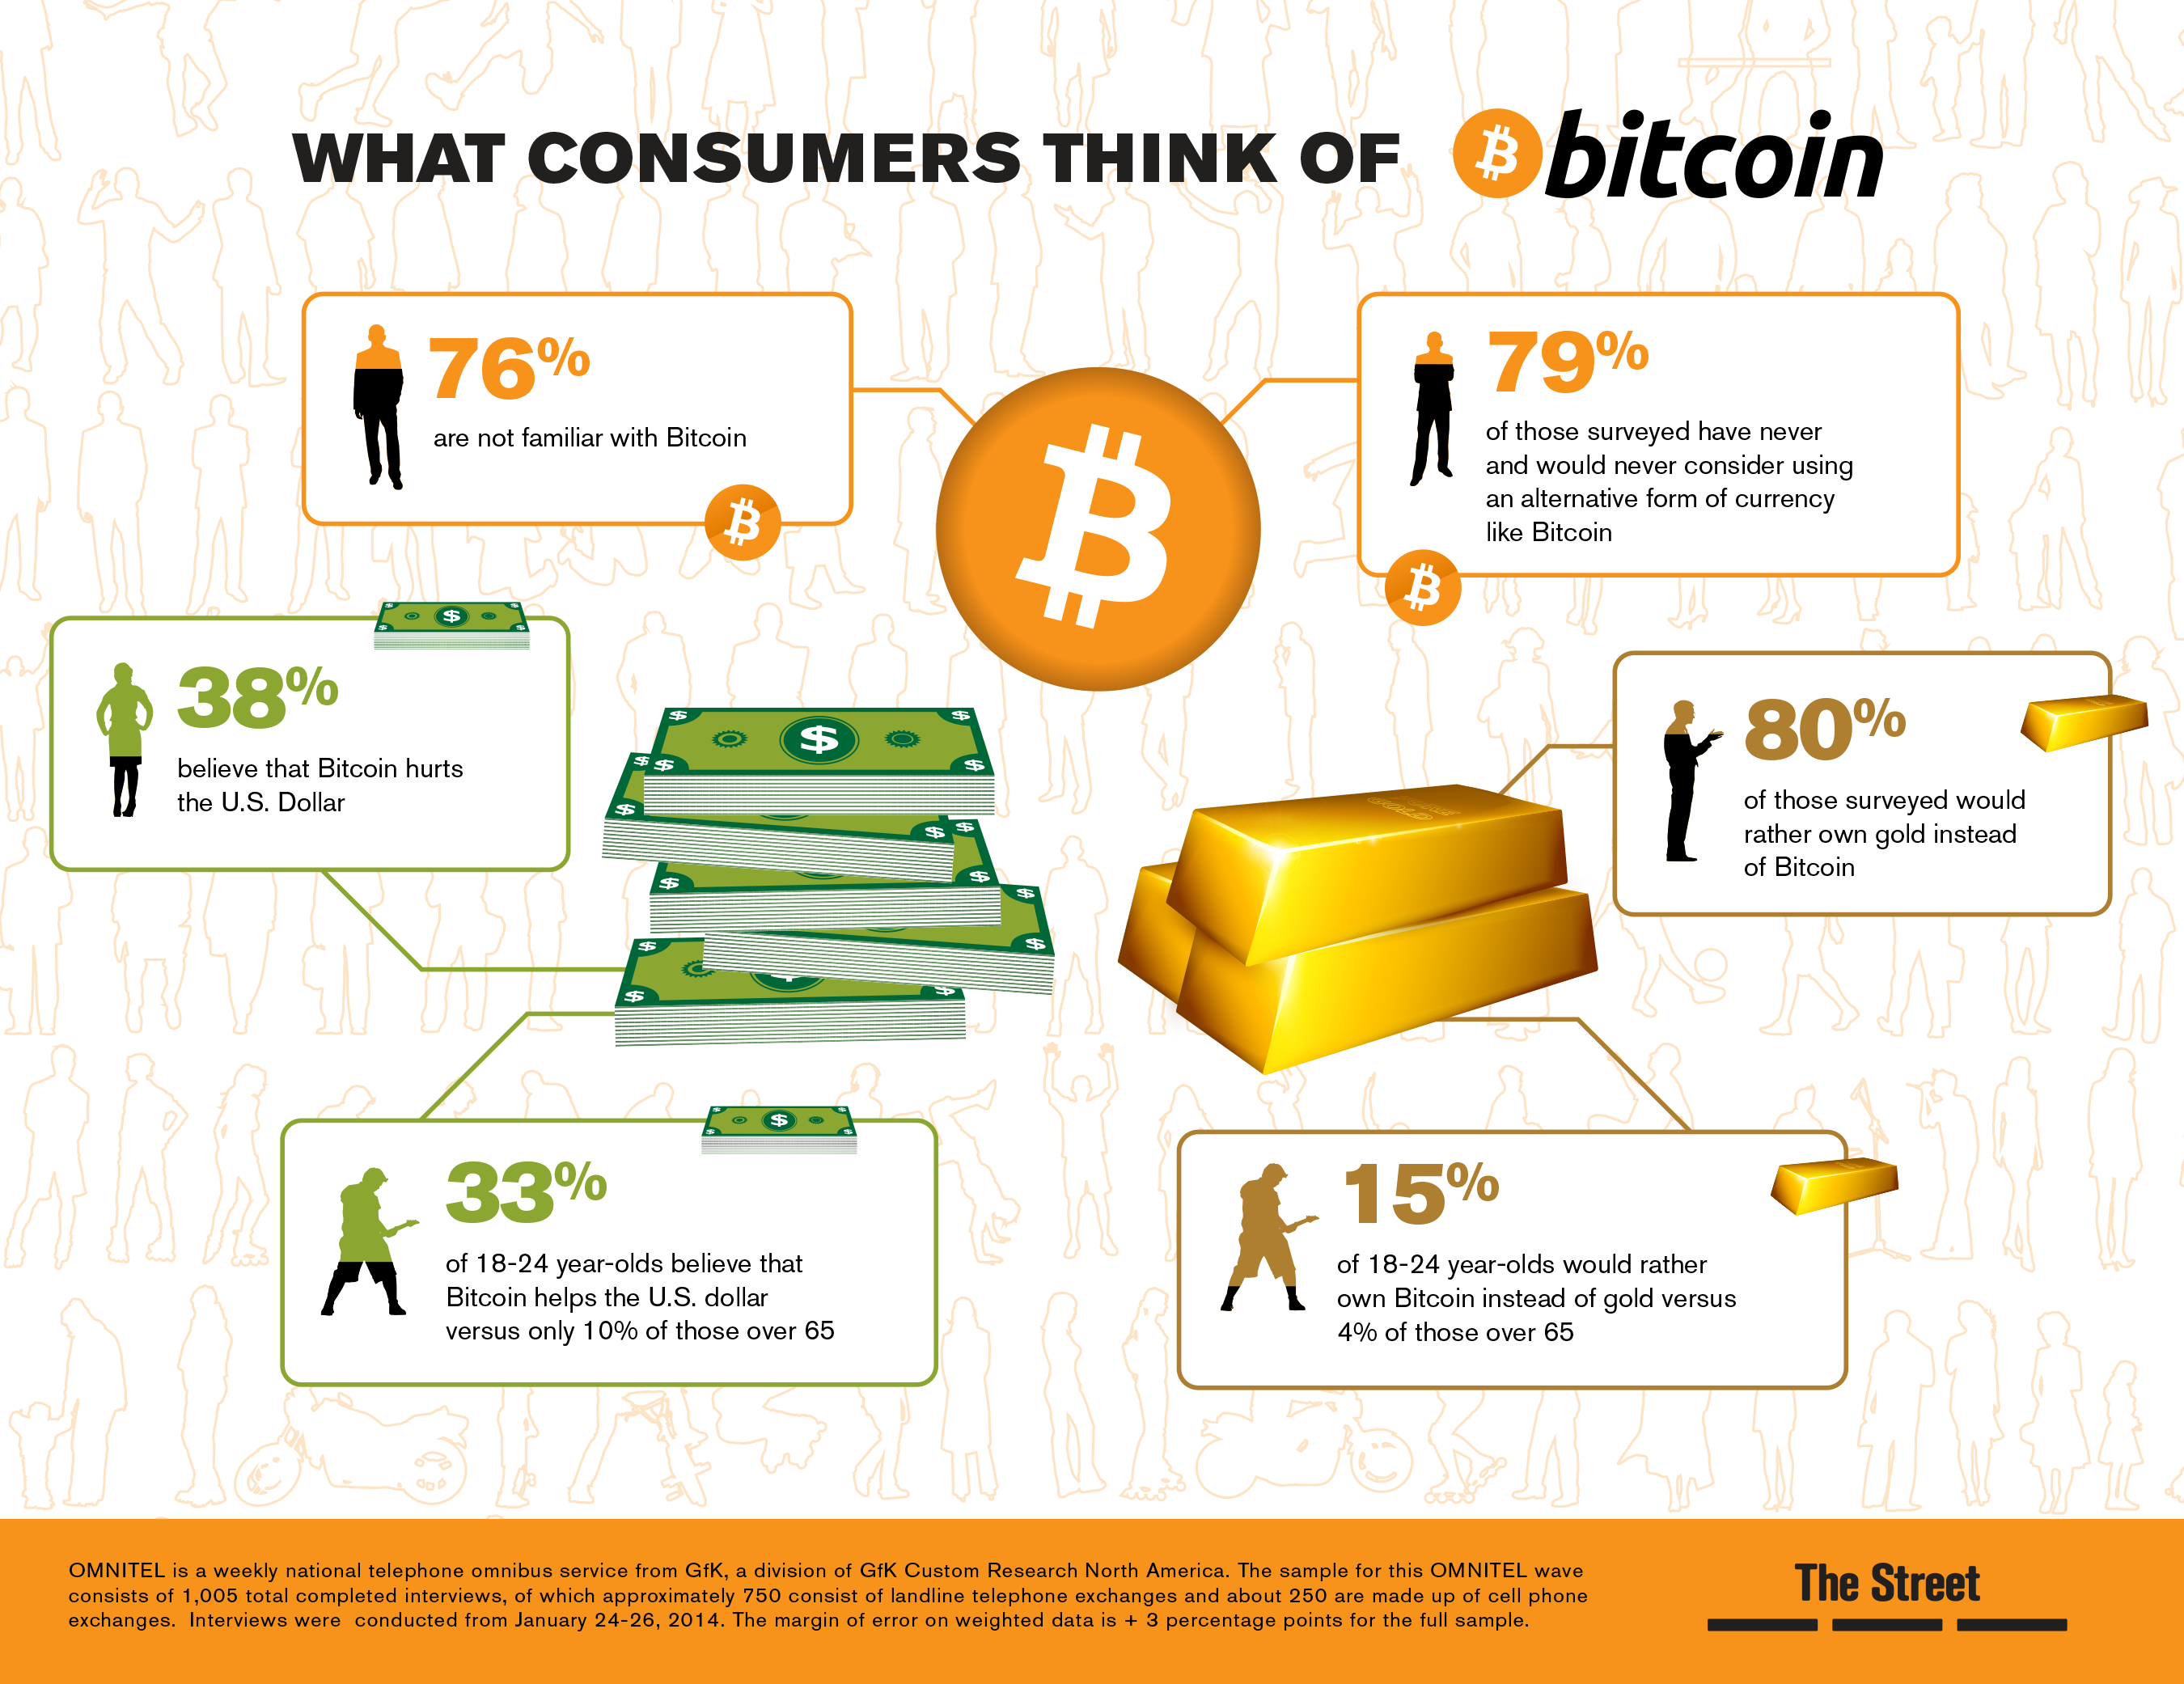
Beliefs and Attitudes
- Percentage of US adults surveyed who were not familiar with Bitcoin in January 2014: 76%
- How many US adults have never and would never consider using an alternative form of currency like Bitcoin: 79%
- How many would rather own gold than Bitcoin: 80%
- Those who believe that Bitcoin hurts the US dollar: 38%
Sources
- Allen, Kent. E-Commerce: Easing Cross-Border E-Commerce. Americas Quarterly. Summer 2013.
- Heel, Bas van, Lukic,Vlad, and Erwin Leeuwis. Cross-Border E-Commerce Makes the World Flatter. Boston Consulting Group. September, 2104.
- Bitcoin. BitInfoCharts. Last accessed September 17, 2014.
- Cross-border ecommerce. Ascel. May 2012.
- Daily Transaction Volume. Coinometrics. Last accessed September 17, 2014.
- Digital Economy and Cross-Border Trade: The Value of Digitally-Deliverable Services. US Department of Commerce. January, 2014.
- E-Commerce in Europe. EMOTA. March 2014.
- Tong, Frang. China’s cross-border e-commerce tops $375 billion in 2012. Internet Retailer. September, 2013.
- What Consumers Think of Bitcoin. The Street. Last accessed September 17, 2014.
